Which Table Represents a Linear Function? (With Easy Examples & Quick Test)
Have you ever looked at a table of numbers and wondered,
“Is this a linear function?”
Let’s break it down in a simple way.
With easy rules.
And quick examples.
What is a Linear Function?
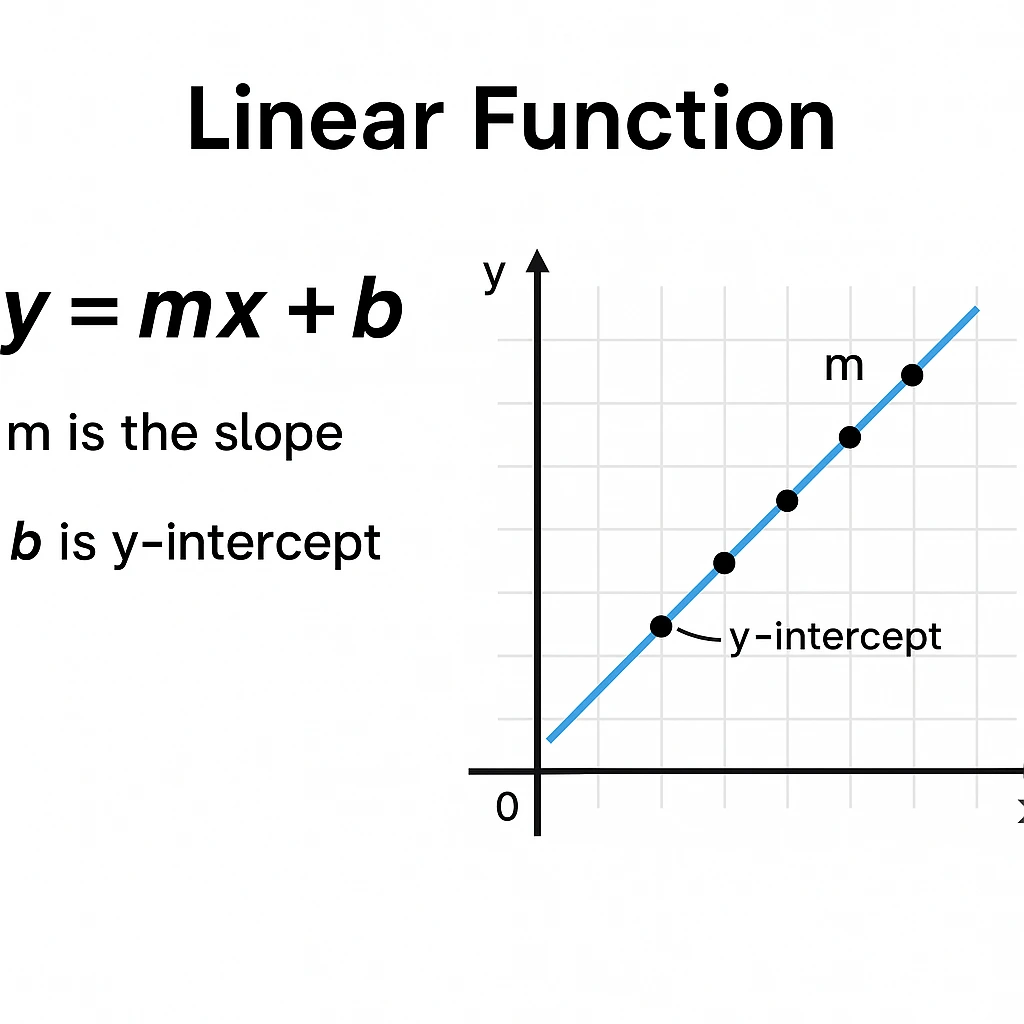
A linear function is a rule that creates a straight line when you graph it.
It follows the form:
y = mx + b
mis the slope (the rate of change)bis the y-intercept
How to Tell from a Table
To find out if a table shows a linear function, use this rule:
Check if the change in y is always the same when x changes by the same amount.
This is called a constant rate of change.
Let’s Try an Example
Here’s a table:
| x | y |
|---|---|
| 1 | 3 |
| 2 | 5 |
| 3 | 7 |
| 4 | 9 |
Let’s check:
- From x=1 to x=2 → y goes from 3 to 5 → change is +2
- From x=2 to x=3 → y goes from 5 to 7 → change is +2
- From x=3 to x=4 → y goes from 7 to 9 → change is +2
✅ The change in y is always +2
So, this table represents a linear function.
Another Example: Is This Linear?
Let’s look at this new table:
| x | y |
|---|---|
| 2 | 6 |
| 4 | 10 |
| 6 | 14 |
| 8 | 18 |
Let’s check the changes step by step.
Step 1: Change in x
- From 2 → 4 → 6 → 8
- Change in x is +2 every time.
Step 2: Change in y
- From 6 → 10 → 14 → 18
- Change in y is +4 every time.
Now check:
Change in y ÷ change in x = 4 ÷ 2 = 2
Since the ratio is the same every time,
✅ this table represents a linear function.
A Non-Example (Not Linear)
| x | y |
|---|---|
| 1 | 2 |
| 2 | 4 |
| 3 | 8 |
| 4 | 16 |
Check the y changes:
- +2 → +4 → +8 → it’s not the same
This is not a linear function
It’s probably an exponential function.
Quick Trick to Remember
If the difference in y is always the same,
and the difference in x is also the same,
✅ it’s linear!
Also Read: ACT Math Formulas
Quick Test: Which Table is Linear?
Here are two tables.
Which one is linear?
Table A:
| x | y |
|---|---|
| 1 | 5 |
| 2 | 8 |
| 3 | 11 |
| 4 | 14 |
Table B:
| x | y |
|---|---|
| 1 | 1 |
| 2 | 4 |
| 3 | 9 |
| 4 | 16 |
Answer: Table A is linear
Because y increases by +3 each time.
Now, find the answer for table B.
Summary
- A linear function has a constant rate of change
- Check if y changes evenly when x increases evenly
- Use this to spot linear tables easily
Want More Help Like This?
Try Study Friend — your AI-powered study buddy.
- Get quick answers
- Generate flashcards
- Build mindmaps
- Track your learning
FAQ: Linear Function from a Table
1. How do you know if a table shows a linear function?
Check if the change in y is always the same when x changes by the same amount.
2. What is a constant rate of change?
A constant rate of change means y changes by the same amount every time x increases by a fixed number.
3. Can a table with unequal x values still be linear?
Yes, as long as the rate of change (Δy/Δx) stays the same.
4. What does a nonlinear table look like?
The changes in y are not consistent. For example: +1, +3, +7, +13.
5. What if y is always the same?
That’s still linear! It’s called a horizontal line (slope = 0).